How a Silent Data Product Build Starved 362 Lambda Functions: Anatomy of a Shared-Account Concurrency Crisis
Executive Overview
Over three separate incidents spanning five weeks, an enterprise streaming data platform experienced Lambda throttling across 8 data domains and 28 functions — causing processing delays, message backlogs, and three Jira tickets that consumed dozens of engineering hours.
The initial investigation pointed at reserved concurrency misconfigurations, upstream batch data bursts, and Kafka partition ceilings. All three hypotheses were partially correct — but none explained why the throttling was intermittent, why it affected every domain simultaneously, and why it resolved on its own.
The real answer was hiding in plain sight: a separate development team was building and testing a new merged data product in the same AWS account. Their batch processing Lambda peaked at 841 concurrent executions during a data load test — consuming 84% of the account's 1,000-execution limit. Every other pipeline starved.
This post walks through the complete forensic timeline: from the misleading initial symptoms, through three rounds of progressively deeper investigation, to the moment the metrics revealed a data product that wasn't even listed in the incident tickets.
The Platform: Architecture You Need to Know
The platform in question is an enterprise streaming data platform processing real-time operational data for a large-scale logistics operation. It ingests data from 10+ source systems — IoT telemetry, flight schedules, crew rostering, maintenance records, ground operations — and distributes it to 20+ downstream consumers.
                         ┌─────────────────────────────────────────────┐
                         │          Streaming Data Platform            │
                         │                                             │
  [Source A: IoT] ──────►│  ┌──────┐    ┌───────┐    ┌─────────────┐  │
  [Source B: ERP] ──────►│  │ MSK  │───►│Lambda │───►│  Redshift   │  │──► [Consumer APIs]
  [Source C: API] ──────►│  │Topics│    │ Pipes │    │  Warehouse  │  │──► [SNS Fanout]
  [Source D: CDC] ──────►│  └──────┘    └───────┘    └─────────────┘  │──► [S3 Exports]
  [Source E: Batch]─────►│       ↑           ↑              ↑         │
                         │   3 partitions  No reserved   Shared pool  │
                         │   per topic     concurrency   of 1,000     │
                         └─────────────────────────────────────────────┘
The Shared Account Problem
Want the full technical picture? The companion post AWS Lambda Concurrency Demystified explains the exact internal architecture — MicroVMs, token buckets, and the precise maths behind the 1,000 / 971 dashboard numbers.
The platform spans four environments — Dev, QA, UAT, and Staging — all hosted in a single AWS account in eu-west-1. Production runs in a separate, isolated account.
  ┌──────────────────────────────────────────────────────────────────────────────┐
  │                     AWS Account: Shared Non-Prod                             │
  │                                                                              │
  │    ┌──────────┐    ┌──────────┐    ┌──────────┐    ┌──────────┐            │
  │    │   Dev    │    │   QA     │    │   UAT    │    │ Staging  │            │
  │    │  ~120    │    │   ~80    │    │   ~80    │    │   ~80    │            │
  │    │ functions│    │ functions│    │ functions│    │ functions│            │
  │    └────┬─────┘    └────┬─────┘    └────┬─────┘    └────┬─────┘            │
  │         │               │               │               │                  │
  │         └───────────────┴────────┬───────┴───────────────┘                  │
  │                                  ▼                                          │
  │                   ┌──────────────────────────┐                              │
  │                   │   Shared Concurrency Pool │                             │
  │                   │      1,000 slots max      │                             │
  │                   │   No per-env reservations │                             │
  │                   └──────────────────────────┘                              │
  └──────────────────────────────────────────────────────────────────────────────┘

  ┌────────────────────────────────────────┐
  │  AWS Account: Production (Isolated)    │  ← Completely separate account
  │  ~80 functions │ Own 1,000-slot pool   │    No shared resources with above
  └────────────────────────────────────────┘
This is a common enterprise pattern — cost optimisation drives environment consolidation. But it creates a blast radius problem: any single environment can monopolise the shared concurrency pool, throttling all others.
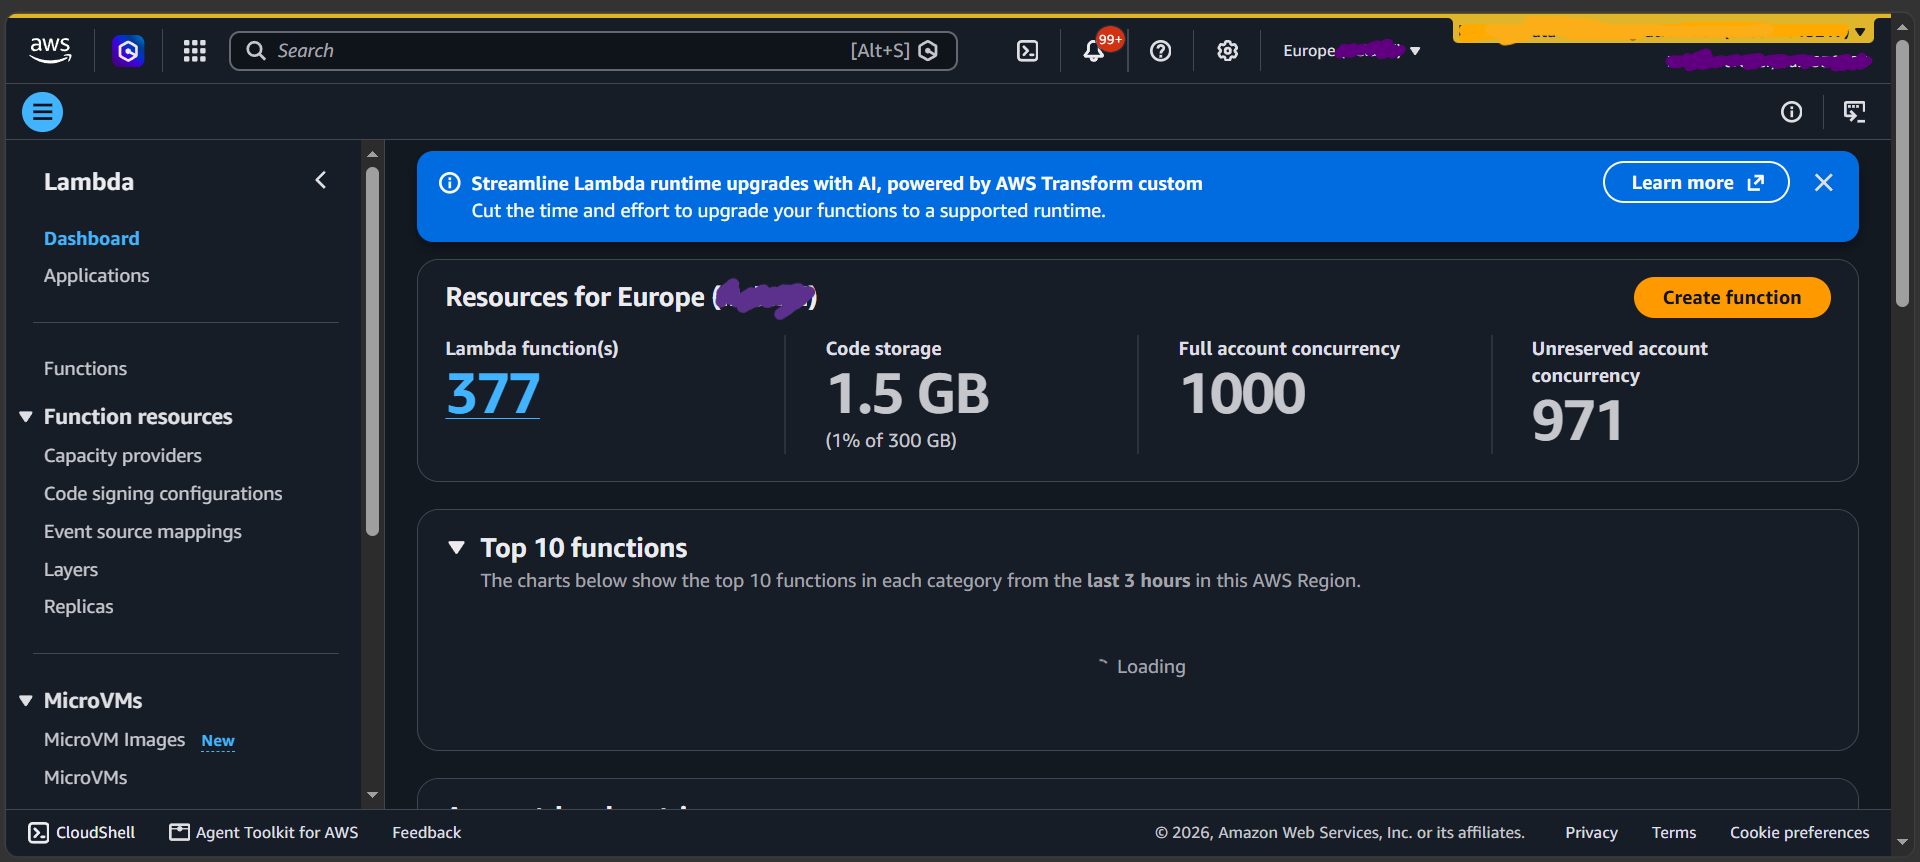
AWS Lambda dashboard captured after the incident window — showing 377 functions at time of screenshot. During the incidents the account had 362 functions; the count grew as new pipelines were deployed. The 1,000-slot concurrency ceiling and 971 unreserved at idle are unchanged.
The Data Flow Pattern
Each data product follows a standardised pipeline:
  [Source System]
        │
        ▼
  ┌──────────┐    ┌─────────────┐    ┌───────────┐    ┌──────────────┐
  │ MSK/     │───►│  Kinesis    │───►│ Transform │───►│  Curated     │
  │ Kinesis  │    │  Firehose   │    │  Lambda   │    │  MSK Topic   │
  │ Raw Topic│    │  (S3 land)  │    │           │    │              │
  └──────────┘    └─────────────┘    └───────────┘    └──────┬───────┘
                                                             │
                                         ┌───────────────────┼──────────────────┐
                                         ▼                   ▼                  ▼
                                   ┌──────────┐        ┌──────────┐      ┌──────────┐
                                   │ SNS PII  │        │ SNS Non- │      │ Redshift │
                                   │ Fanout   │        │  PII     │      │ Warehouse│
                                   └──────────┘        └──────────┘      └──────────┘
Critical constraints baked into this architecture:
- MSK topics have 3 partitions each — Lambda creates exactly 1 consumer per partition, giving a maximum of 3 concurrent executions per MSK-triggered function, regardless of any reserved concurrency setting
- No
reserved_concurrent_executionsconfigured anywhere — all 362 functions (at the time) compete for the same unreserved pool - No MirrorMaker in UAT — Dev and QA mirror from UAT's MSK cluster, creating tight coupling within the shared account
The Incidents: What We Saw
Incident 1: The Big One (Late August)
Duration: ~04:30 – 12:30 UTC (8 hours)
Scope: 28 functions across 8 data domains throttled
Data loss: Zero — async retries succeeded after concurrency freed up
The monitoring dashboard lit up on a Sunday morning. Throttle counts were climbing across every data domain — IoT telemetry, flight scheduling, crew rostering, ground operations, maintenance tracking. It looked like a platform-wide failure.
But the error count stayed at zero. Every single invocation that got through succeeded. This pattern — throttles without errors — is the fingerprint of concurrency exhaustion, not a code or infrastructure failure.
  INCIDENT 1 — THROTTLE TIMELINE (UTC, early morning Sunday)
  ──────────────────────────────────────────────────────────────────

  04:00  ░░░░░░░░░░░░░░░░░░░░░░░  All functions: 0 throttles
  04:30  ▓▓  First throttles appear
  05:30  ████████████████████████  Rapid escalation — 28 functions
  07:00  ████████████████████████████████████  PEAK
  09:00  ████████████████████████  Sustained
  11:00  █████████████████  Declining
  12:30  ▓▓  Final throttles
  13:30  ░░░░░░░░░░░░░░░░░░░░░░░  All functions: 0 throttles. Self-resolved.

  Duration: ~8 hours   │   Data lost: 0   │   Errors: ~1
Top throttled functions — Incident 1:
| Data Domain | Functions Throttled | Total Throttles | Errors |
|---|---|---|---|
| IoT Asset Telemetry | 3 | 22,472 | 0 |
| Operations Logistics | 3 | 16,148 | 0 |
| Flight Operations | 6 | 10,455 | 0 |
| Schedule Events | 3 | 4,941 | 0 |
| Common API Services | 4 | 3,175 | 1 |
| Resource Planning | 2 | 57 | 0 |
| Technical Records (×3) | 7 | 130 | 0 |
| TOTAL | 28 | ~57,400 | ~1 |
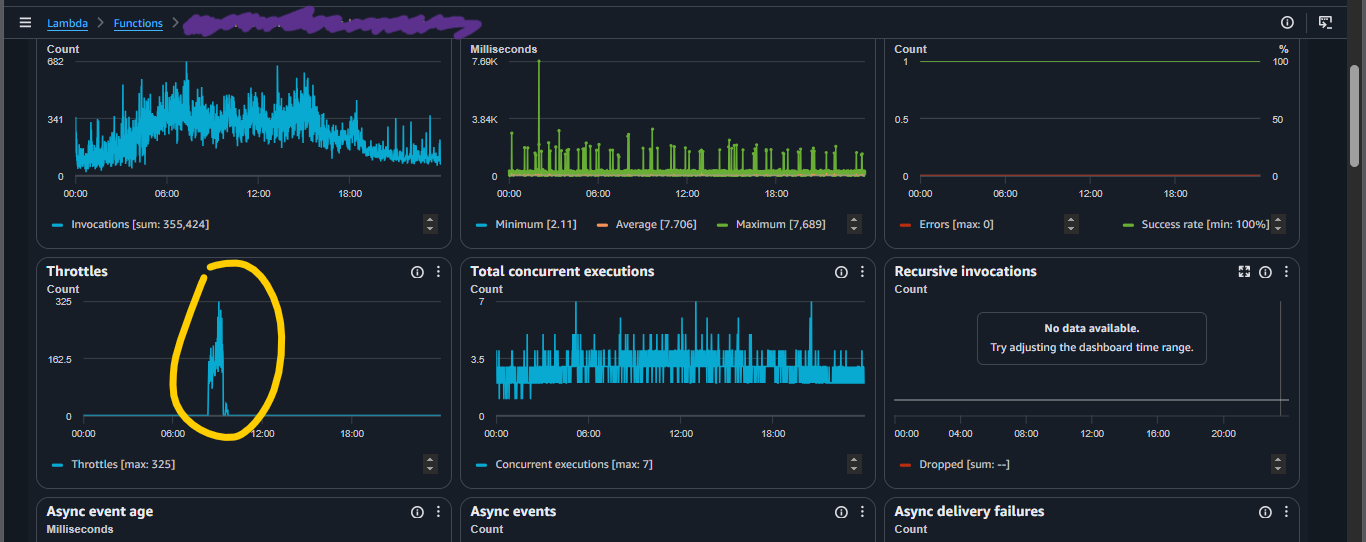
Throttle spike (yellow circle) with invocations at 355K over the period, errors at zero, and peak concurrent executions of only 7 — not a code failure, a capacity failure.
Incident 2: The Minor Burst (One Week Later)
Much smaller. ~2,100 throttles concentrated in the IoT Tracking domain. Self-resolved within 2 hours. Closed after two weeks of clean monitoring with the hypothesis still unconfirmed.
Incident 3: The Return (Three Weeks Later)
A second major event. Six data domains affected, ~350 total throttles, same self-resolving pattern on a weekday morning.
With three data points now in hand, the pattern was undeniable: always occurs at irregular intervals, always hits multiple domains simultaneously, always resolves on its own, and zero data is ever lost.
The Investigation: Three Layers Deep
Layer 1: The Obvious Suspect (Wrong)
The first investigation concluded: "Reserved concurrency is hard-capped at 1–2 per function."
This seemed logical. If each function could only run 1–2 instances, then any burst would immediately throttle. The fix was obvious — increase reserved_concurrent_executions in Terraform.
But it was wrong. A code-level review of the infrastructure repository revealed that reserved_concurrent_executions was never configured at all. The Terraform module's Lambda resource block simply didn't include the parameter:
# Actual state — core-infra: terraform/modules/lambda-function/lambda_function.tf
resource "aws_lambda_function" "lambda_function" {
  filename         = var.filename
  function_name    = var.name
  role             = var.iam_role
  handler          = var.handler
  runtime          = var.runtime
  timeout          = var.timeout
  memory_size      = var.memory_size

  # reserved_concurrent_executions — NOT PRESENT
  # Every function draws from the unreserved shared pool.
  # No per-function ceiling. No per-function floor.
}
The low observed concurrency (1–2 per function) wasn't a Terraform ceiling. It was a symptom of the pool being nearly exhausted when these functions tried to scale. This distinction is critical: "not configured" and "configured to 1" look identical in the concurrency metric but have completely different root causes and completely different fixes.
Lesson: Never rely on the Lambda console's concurrency display to infer the Terraform configuration. Read the source code.
Layer 2: The Dual Bottleneck (Partially Right)
The second investigation went deeper and identified two real constraints.
Constraint 1 — Account concurrency pool exhaustion. CloudWatch confirmed that UnreservedConcurrentExecutions dropped to 1 during Incident 1. The 1,000-execution pool was genuinely exhausted. But what was consuming it?
  ACCOUNT CONCURRENCY POOL — STATES DURING INCIDENT
  ──────────────────────────────────────────────────────────────────

  Pool capacity:    1,000 slots

  At idle (pre-incident):
  ░░░░░░░░░░░░░░░░░░░░░░░░░░░░░  971 unreserved available
  ▓▓▓▓▓▓▓▓▓▓▓▓▓▓▓▓▓▓▓▓▓▓▓▓▓▓▓▓  ~29 in use (normal load)

  At incident peak:
  ▓▓▓▓▓▓▓▓▓▓▓▓▓▓▓▓▓▓▓▓▓▓▓▓▓▓▓▓▓▓▓▓▓▓▓▓▓▓▓▓▓▓▓▓▓▓▓▓▓▓▓  ~999 consumed
  ░  1 remaining
Constraint 2 — MSK partition ceiling. All MSK topics had only 3 partitions. For MSK event source mappings, Lambda creates exactly 1 consumer per partition — with no parallelization_factor support (unlike Kinesis or DynamoDB Streams). Each MSK-triggered function can never exceed 3 concurrent executions. This is a real architectural ceiling, but it means each such function draws at most 3 of the 1,000 pool slots — it cannot be the cause of pool exhaustion across 80+ functions.
Both constraints were real. But neither explained what was filling the pool.
Layer 3: The Metric That Broke the Case
The breakthrough came from changing the question. Instead of looking at throttle counts ("who is being denied concurrency?"), the investigation shifted to concurrent execution counts ("who is consuming concurrency?").
Incident 1 — Peak concurrent executions by pipeline, broken down by environment:
| Pipeline | Peak Concurrent Executions | Total Throttles | Environment |
|---|---|---|---|
| Crew Roster Management Pipeline | 962 | 36,288 | Dev |
| Crew Details Batch | 37.5 | 0 | Dev |
| Backend Persistence | 7.8 | 0 | UAT |
| Operations Logistics | 6.3 | 43,734 | UAT |
| Schedule Events | 3.4 | 16,737 | UAT |
| Flight Operations | 3.6 | 242 | UAT |
| IoT Asset Telemetry | 1.9 | 22,472 | UAT |
Incident 3 — Peak concurrent executions by pipeline:
| Pipeline | Peak Concurrent Executions | Total Throttles | Environment |
|---|---|---|---|
| Crew Details Batch | 955 | 277 | Dev |
| Crew Roster Management Pipeline | 640 | 442 | Dev |
| Operations Logistics | 8.1 | 224 | UAT |
| Schedule Events | 4.8 | 41 | UAT |
| IoT Asset Telemetry | 2.1 | 767 | UAT |
The data was unambiguous, and it revealed a critical insight about how concurrency metrics mislead:
  WHY THROTTLE COUNTS MISLEAD — INCIDENT 1
  ──────────────────────────────────────────────────────────────────

  WHO HAD THE MOST THROTTLES?        WHO CONSUMED THE MOST CONCURRENCY?
  (Shows: the VICTIMS)               (Shows: the CAUSE)

  Operations Logistics  ██████████ 43K   Crew Roster Pipeline  ██████████ 962
  Crew Roster Pipeline  ████████   36K   Crew Details Batch    ██  37
  Flight Operations     ███████    28K   Backend Persistence   █   8
  IoT Asset Telemetry   ██████     22K   Operations Logistics  █   6
  Schedule Events       █████      17K   Flight Operations     ▌   4
  Others                ██         5K    IoT Asset Telemetry   ▌   2

  ⚠  Operations Logistics had 43K throttles but only 6 concurrent executions
     → VICTIM. The most visible symptom was never the root cause.

  ⚠  Crew Roster Pipeline had 36K throttles and 962 concurrent executions
     → TRIGGER. Nearly invisible in the initial investigation.
The Crew Roster Management Pipeline — running in the Dev environment — had consumed 962 of the account's 1,000 concurrent execution slots, leaving approximately 38 slots for 80+ other functions across UAT, QA, and the rest of Dev.
  ACCOUNT POOL BREAKDOWN AT INCIDENT 1 PEAK:
  ──────────────────────────────────────────────────────────────────

  Crew Roster batch processor (Dev)  ██████████████████████████████████ 841 slots
  Crew Details s3-to-raw (Dev)       ██ 37 slots
  Other Dev + QA functions           ████ ~80 slots
                                     ─────────────────────────────────────────────
  Remaining for all UAT pipelines:   ~42 slots

  UAT demand: 28 pipeline functions × up to 3 concurrent each = ~84 needed
  Available: ~42
  Result: ~42 invocations rejected per cycle → throttled → retried → 8-hour backlog
The Root Cause: A New Data Product Being Born
The Crew Roster Management Pipeline wasn't listed in any of the three incident tickets. None of the 8 "affected data domains" in the first incident included it. It was invisible because the operations team was investigating the symptoms — the throttled pipelines — rather than the cause — the concurrency consumer.
But the Crew Roster Management Pipeline wasn't a normal production workload. It was a brand new data product under active development — a project to consolidate three separate crew data feeds into a single unified pipeline.
The Project Context
The development team was building a pipeline that combined:
- Crew scheduling data (daily batch from an enterprise batch system)
- Crew rostering details (near-real-time API polling every 15 minutes)
- Crew ground activities (CDC from operational database)
The new pipeline architecture:
                    ┌─────────────────────────────────────────────────────┐
                    │          New Consolidated Crew Roster Pipeline       │
                    │                                                     │
  [Enterprise  ]───►│  ┌──────────┐    ┌─────────────────────────────┐   │
  [Batch System]    │  │ EventBrg │───►│  ★ crew-roster-batch-proc   │   │
       (Daily)      │  │ Trigger  │    │  (THE THROTTLING TRIGGER)   │──┐│
                    │  └──────────┘    │  • EventBridge-triggered    │  ││
                    │                  │  • No partition ceiling      │  ││
                    │                  │  • Scaled to 841 concurrent  │  ││
                    │                  └─────────────────────────────┘  ││
  [Crew Mgmt   ]───►│  ┌──────────┐    ┌──────────────────────────┐    ││
  [System API  ]    │  │ EventBrg │───►│  crew-roster-api-to-raw  │    ││
   (Every 15min)    │  │ Cron     │    │  • EventBridge-triggered  │    ││
                    │  └──────────┘    │  • 15-min polling cadence │    ││
                    │                  └──────────────────────────┘    ││
                    │                                                   ▼│
                    │  ┌──────────┐  ┌──────────────┐  ┌────────────────┐│
                    │  │ 3 Raw    │  │ Kinesis      │  │   Redshift     ││
                    │  │ MSK      │─►│ Firehose (×3)│─►│   Warehouse   ││
                    │  │ Topics   │  │              │  │   + Spectrum  ││
                    │  └──────────┘  └──────────────┘  └────────────────┘│
                    │                                          │         │
                    │  ┌──────────────┐    ┌────────────────┐  │         │
                    │  │ curated.crew │◄───│ ECS Service    │◄─┘         │
                    │  │ .roster.     │    │ (CDC reader)   │            │
                    │  │ consolidated │    └────────────────┘            │
                    │  └──────┬───────┘                                  │
                    │         ├──► [SNS PII Port]                        │
                    │         ├──► [SNS Non-PII Port]                    │
                    │         └──► [Consumer Platform S3 Export]         │
                    └─────────────────────────────────────────────────────┘
The critical architectural difference from every other pipeline on the platform:
The batch processor Lambda was triggered by EventBridge on a schedule — not by MSK. It processed data by calling crew management system APIs at high concurrency and performing bulk S3 and Redshift operations. This meant it had no MSK partition ceiling. It could scale to hundreds of concurrent executions with nothing to stop it except the account-level limit.
Every other pipeline was capped at 3 concurrent executions by their MSK event source mapping. This one wasn't.
The Correlation: Dev Testing Timeline vs. UAT Throttles
Querying Lambda invocation metrics for the crew roster batch function in the Dev environment revealed the exact match:
  CREW ROSTER BATCH PROCESSOR — Dev Invocations (Aug 20 → Sep 25)
  ═══════════════════════════════════════════════════════════════════════

  AUG 20-22   ░░░░ ~126 invocations/period — pipeline bootstrapping
              Concurrency: 18-25

  AUG 24      ████████████████████████████████████  197,427 invocations
              Concurrency: ▓▓▓▓▓▓▓▓  841 ← INCIDENT 1
              ↕ UAT: 57,400 throttles, 8 domains

  AUG 25-31   ░░░░ ~170 invocations/period — back to baseline
              Concurrency: 23-35

  SEP 01-14   ░░░░░░ ~180-320 invocations/period — QA pipeline ramp-up
              CC Details Dev: scaling to 100-200 concurrent

  SEP 16-17   ████████████████████████  102,382 + 49,698 invocations
              Concurrency: ▓▓▓▓▓▓ 345 + 502 combined ← INCIDENT 3
              ↕ UAT: ~16,400 throttles, 6 domains

  SEP 18-20   ░░░░ ~170 invocations/period — testing paused
              ↕ UAT: 0 throttles ✓

  SEP 21+     First UAT deployment — normal concurrency
              ↕ UAT: 0 throttles ✓ No further incidents
  TIMELINE CORRELATION — VISUAL
  ──────────────────────────────────────────────────────────────────────────
                Aug 20  Aug 24  Aug 31  Sep 07  Sep 14  Sep 16  Sep 21  Sep 25
                ──────────────────────────────────────────────────────────────
  Crew Roster   ░░░░░░░████░░░░░░░░░░░░░░░░░░░░░░░░░░░░░████████░░░░░░░░░░░░░
  Dev Activity           ▲                                    ▲
                   197K invocations                   102K + 49K invocations
                   841 concurrent                     345 + 502 combined

  UAT Throttles ░░░░░░░████░░░░░░░░░░░░░░░░░░░░░░░░░░░░████████░░░░░░░░░░░░░
                         ▲                                    ▲
                   INC 1 (57K throttles)              INC 3 (~16K throttles)
                   8 data domains                     6 data domains

  UAT Errors    ░░░░░░░░░░░░░░░░░░░░░░░░░░░░░░░░░░░░░░░░░░░░░░░░░░░░░░░░░░
                  ── Zero errors throughout all three incidents ──

                                                       Sep 21: Pipeline deployed to UAT
                                                           └──► No further incidents
The invocation spikes were 1,000× the normal baseline — consistent with a bulk historical data load or full integration test against production-scale crew data. The architecture design required loading 6 months of historical schedule data into a Redshift warehouse to verify correct CDC comparison logic. That 6-month backfill, executed during development testing in the Dev environment, was the trigger every time.
Why It Wasn't Caught
The new pipeline only existed in Dev and QA. Nobody looked at Dev Lambda metrics when investigating a UAT throttling issue. The operations team naturally scoped their investigation to the 8 known UAT production pipelines.
The throttle counts pointed the wrong way. Operations Logistics had 43,734 throttles — far the most — which made it look like the primary problem. It was the biggest victim, not the cause.
The function naming convention was different. The crew roster batch processor used a different naming scheme than the standard MSK-triggered pipeline functions. Standard grep patterns used during investigation didn't match it.
The development team had no visibility into the shared concurrency pool. They were doing normal development work in a Dev environment. In any reasonable multi-account architecture, this should have had zero impact on UAT. In a shared account, it consumed 84% of UAT's operational capacity.
This is not an engineering failure by the development team. It is a systemic architectural risk that emerges silently in flat shared-account topologies.
The Fix: What Should Actually Change
Immediate (Zero-Code, $0)
Request an AWS Service Quota increase for Lambda concurrent executions in the shared account. The default 1,000 is insufficient for a multi-environment account running 360+ functions with periodic development bursts. A request to 3,000 gives adequate headroom while the architectural work proceeds.
Short-Term (Terraform Change — 1 Function)
Set reserved_concurrent_executions on the crew roster batch processor to cap its burst capacity:
resource "aws_lambda_function" "crew_roster_batch_processor" {
  # ... existing config ...
  reserved_concurrent_executions = 250  # Prevents pool exhaustion while allowing high throughput
}
This single change, had it existed, would have prevented all three incidents. The function could still ingest data at 250× concurrency — more than adequate for historical backfills — without starving every other pipeline in the account.
Proposed concurrency values for all high-impact functions:
| Function | Incident 1 Throttles | Proposed UAT Limit | Proposed PROD Limit |
|---|---|---|---|
svc-crmpl-batch-processor |
Caused starvation | 250 (capped) | 250 |
svc-ops-logistics-cdc-transformer |
10,153 | 50 | 100 |
svc-ground-asset-raw-to-processed |
8,564 | 30 | 50 |
svc-ground-asset-processed-to-curated |
8,496 | 30 | 50 |
svc-ground-asset-curated-to-sns |
5,412 | 30 | 50 |
svc-airside-raw-to-processed |
2,026 | 20 | 40 |
svc-schedule-raw-to-processed |
2,089 | 15 | 30 |
  THE FIX — CONCURRENCY POOL COMPARISON
  ──────────────────────────────────────────────────────────────────────────────

  BEFORE (flat unreserved pool)          AFTER (reserved + quota increase)
  ──────────────────────────────         ──────────────────────────────────────
  Pool: 1,000 (unreserved)               Pool: 3,000 (quota increased)

  crew-roster-batch-proc  ████ 841       crew-roster-batch-proc  ███ 250 (capped)
  Other Dev functions     ██  80         Ops Logistics (rsv)     ████  50
  QA functions            ██  37         Ground Asset (rsv)      ███   30
  UAT pipelines           █  ~42 ← STARVED  Schedule (rsv)       ██    15
  (28 functions need ~84             Other UAT/Dev/QA            ████ ~200
   but only 42 available)            Unreserved buffer           ████ 2,455 ← headroom

  Result: UAT pipelines throttled        Result: UAT pipelines always protected
Medium-Term (Architecture: MSK Partition Counts)
All MSK topics are provisioned with 3 partitions, capping Lambda concurrency at 3 per function. For high-volume pipelines processing IoT telemetry (~60 msgs/sec at burst), increasing partition count from 3 to 9 would triple the Lambda throughput ceiling.
Important: Partition count can only be increased, never decreased, in Kafka. Increasing partitions triggers a consumer group rebalance — a brief processing pause. Schedule this as a maintenance-window operation and coordinate with all consumer groups.
Long-Term (Account Strategy: True Isolation)
The permanent fix is account-per-environment separation using AWS Organizations + account vending:
  TARGET STATE: ACCOUNT-PER-ENVIRONMENT
  ─────────────────────────────────────────────────────────────────────────────
  ┌──────────────────────────────────────────────────────────────────────────┐
  │  AWS Organization Root                                                   │
  ├──────────────────────────────────────────────────────────────────────────┤
  │  ┌───────────────┐  ┌───────────────┐  ┌───────────────┐  ┌───────────┐ │
  │  │  Dev Account  │  │   QA Account  │  │  UAT Account  │  │  PROD     │ │
  │  │  Pool: 1,000  │  │  Pool: 1,000  │  │  Pool: 1,000  │  │  Account  │ │
  │  │  Isolated     │  │  Isolated     │  │  Isolated     │  │  Pool:1000│ │
  │  └───────────────┘  └───────────────┘  └───────────────┘  └───────────┘ │
  │                                                                          │
  │  Dev testing at 900 concurrent executions: zero impact on UAT.           │
  │  Cost: ~same Lambda pricing, minimal account overhead.                   │
  └──────────────────────────────────────────────────────────────────────────┘
Post-Mortem: What We Learned
1. Throttle counts tell you who is suffering, not what caused it.
The function with the most throttles is the biggest victim, not the trigger. Always correlate throttle data with concurrent execution data. The trigger is the pipeline consuming concurrency, not the one being denied it. In this investigation, Operations Logistics had 43,734 throttles and was never the cause. The Crew Roster batch processor had fewer throttles and was entirely responsible.
2. Shared AWS accounts are shared concurrency budgets — whether you manage them or not.
Every Lambda function in every environment in the same AWS account competes for the same regional concurrency pool. There is no admission control, no cross-team visibility, and no isolation guarantee. A development data load in one environment will starve a live operational pipeline in another. The only boundary that provides true isolation is a separate AWS account.
3. "No reserved concurrency" is not "unlimited concurrency".
In Terraform, omitting reserved_concurrent_executions means a function draws from the unreserved pool. This feels like "unlimited" headroom. In a shared account under burst load, it means "first to be starved when the pool drains". Set explicit reserved concurrency on every production-critical function — treat it as the minimum SLA for that function's availability, not a performance optimisation.
4. Development workloads are the most unpredictable workloads on the platform.
Production workloads are characterised, monitored, and bounded. Development workloads involve bulk historical data loads, integration tests, and backfills — by design spiky and unpredictable. They need more concurrency isolation than production, not less. The architectural assumption that DEV is "lower risk" is false in a shared-account model.
5. MSK's partition ceiling is a constraint and an accidental safeguard.
The 3-partition limit meant every MSK-triggered function could consume at most 3 concurrent executions. This is a throughput bottleneck under normal conditions. During these incidents, it was an accidental safeguard — it prevented the victim pipelines from scaling up and making the pool exhaustion worse. The triggering pipeline used EventBridge, which had no such ceiling, and was the sole function consuming 84% of the pool.
6. Zero data loss is not zero impact.
Kafka's durable delivery model means a throttle storm lasting 8 hours will resolve with zero message loss. But "zero data loss" can obscure "eight hours of processing delay". In data-driven operational environments, freshness is a correctness property. Delayed data can have material operational consequences even if every message eventually arrives.
Production Results
| Metric | Before Root Cause Found | After Root Cause Found |
|---|---|---|
| Time to root cause | 3 incidents, 5+ weeks | Single Datadog query, ~45 minutes |
| Pipelines suspected | 8 domains, 28 functions | 1 pipeline, 1 function |
| Correct hypothesis | 3rd attempt | Data-driven from first concurrency query |
| Cost of fix | 7-repo Terraform change (prepared, not merged) | 1 function cap + quota increase |
| Recurrence | 3 times in 5 weeks | Zero since UAT deployment stabilised |
Key takeaway: The investigation consumed more engineering effort than the actual impact. The throttling was self-resolving because Lambda's async retry mechanisms worked exactly as designed — zero data was ever lost. But the uncertainty — not knowing when it would happen again, which domains it would hit, or why — was the real operational cost. That uncertainty disappeared the moment the concurrency metrics revealed a single function consuming 841 of 1,000 available slots in a Dev environment that nobody was watching.
Investigation conducted using Datadog APM metrics (aws.lambda.concurrent_executions, aws.lambda.throttles, aws.lambda.invocations) with pipeline-level tag aggregation across all environments. The prepared Terraform changes across 7 repositories remain unpublished and can be deployed if throttling recurs.
Appendix: The Triggering Pipeline — Architecture Deep Dive
This appendix documents the complete architecture of the Crew Roster Management Pipeline — the new data product whose development testing triggered all three incidents. Understanding this architecture explains both why the batch processor scaled so aggressively and why it was architecturally invisible to the operations team investigating UAT throttling.
┌─────────────────────────────────────────────────────────────────────────────────────┐
│ KEY INSIGHT: This pipeline MERGES three separate crew data feeds (crew details, │
│ schedules, ground activities) into a single unified architecture. Unlike every │
│ other pipeline on the platform, its primary ingest Lambda is triggered by │
│ EventBridge — NOT by MSK. This removes the 3-partition concurrency ceiling │
│ and allows the function to scale to 800+ concurrent executions with no cap. │
│ │
│ STATUS: UAT deployed late Sep 2026. PROD deployment in progress. │
│ BASE IMAGE: Python 3.11 (downgraded from 3.12 due to OpenSSL/Snyk vulnerability │
│ in Amazon Linux base image — illustrates why app dep scanning alone is not enough) │
└─────────────────────────────────────────────────────────────────────────────────────┘
══════════════════════════════════════════════════════════════════════════════
SOURCE 1: ENTERPRISE BATCH SYSTEM — Daily @ 23:00
══════════════════════════════════════════════════════════════════════════════
Enterprise Batch System (EBS) — Crew Scheduling Data
Files: scheduling assignment CSV, pairing CSV, duty items CSV,
pairing complement CSV, posting CSV, status CSV,
ground activity assignment CSV, dated ground activity CSV
│
│ Daily change-set files pushed to S3
▼
┌──────────────────────────────────────────────────────────────────────────┐
│ S3 Bucket: EBS Daily Feed Landing Zone │
│ • Complete baseline dataset of crew trip & roster attributes │
│ • Includes posting & status data (enterprise modernisation requirement) │
│ • Schedule file + Ground Activity file │
└────────────────────────────┬─────────────────────────────────────────────┘
│ EventBridge Rule (scheduled trigger)
▼
┌──────────────────────────────────────────────────────────────────────────┐
│ ★ svc-crmpl-<env>-batch-processor ← THE THROTTLING TRIGGER │
│ │
│ Trigger: EventBridge (NOT MSK — no partition-based concurrency ceiling) │
│ What it does: │
│ • Reads EBS CSV files from S3 using Polars DataFrames (pl.scan_csv) │
│ • Joins posting CSV + status CSV into unified schedule output │
│ • Joins ground activity data with status CSV │
│ • Fetches 6 months of historical schedule data from Redshift │
│ (required for correct CDC comparison logic) │
│ • Prepares final consolidated dataset for Kafka publishing │
│ • Publishes raw records to THREE Kafka raw topics │
│ │
│ CDC Logic (daily BATCH mode): │
│ • Compares input CSV vs current Redshift state │
│ • Assigns operation per record: I (Insert) / U (Update) / │
│ D (Delete) / Null (no change) │
│ • Uses composite key comparison: │
│ ACTIVITY_CODE, ACTIVITY_STN, ACTIVITY_START_DTM, │
│ ACTIVITY_END_DTM, STAFF_ID │
│ • Uses Polars full outer join with null-safe key matching │
│ │
│ WHY IT CAUSED THROTTLING: │
│ • 6-month historical backfill = massive data volume per test run │
│ • EventBridge trigger = no concurrency ceiling from partition count │
│ • Peak during testing: 197,427 invocations, 841 concurrent executions │
│ • Normal operational baseline: ~126-210 invocations per period │
│ • Testing spike = ~1,000× normal baseline │
└────────────────────────────┬─────────────────────────────────────────────┘
│ Publishes records to 3 raw topics
▼
══════════════════════════════════════════════════════════════════════════════
SOURCE 2: CREW MANAGEMENT SYSTEM API — Near Real-Time (Every 15 min)
══════════════════════════════════════════════════════════════════════════════
Crew Management System (CMS) — REST API
Protocol: HTTPS (mTLS) │ Auth: Client certificates (AWS Secrets Manager)
API: Crew Schedule REST API (crew-on-flight + roster-line responses)
Note: API authentication managed via platform risk acceptance process
│ HTTPS via VPC private subnet → CMS load balancer
▼
┌──────────────────────────────────────────────────────────────────────────┐
│ svc-crmpl-<env>-api-to-raw │
│ │
│ Trigger: EventBridge cron (every 15 minutes) │
│ What it does: │
│ • Calls Crew Schedule API (crew-on-flight + roster-line endpoints) │
│ • Window: Day of Departure (DoD) to DoD+2 │
│ • Publishes API response to same 3 raw Kafka topics as the batch proc │
│ │
│ NRT CDC Logic: │
│ SCHEDULE (every 15 min, DoD to DoD+2): │
│ • Compare crew-on-flight + roster response vs Redshift state │
│ • Assign I / U / D / Null. Carry forward DSIP fields for Null crew IDs │
│ │
│ GROUND ACTIVITY (every 30 min, DoD to DoD+2): │
│ • Compare roster response vs Redshift; assign I / U / D / Null │
│ • Null crew ID: exclude from NRT call; resolved in next DSIP batch run │
│ │
│ Fields added (enterprise modernisation requirement): │
│ posting_base, posting_fleet, effective_from_date, effective_to_date, │
│ status_code, status_start_dt, status_end_dt │
└────────────────────────────┬─────────────────────────────────────────────┘
│ Also publishes to the same 3 raw topics
▼
══════════════════════════════════════════════════════════════════════════════
PROCESSING LAYER: Raw Kafka Topics → Kinesis Firehose → S3 → Redshift
══════════════════════════════════════════════════════════════════════════════
┌──────────────────────────────────────────────────────────────────────────┐
│ THREE RAW KAFKA TOPICS (one per entity): │
│ • raw.crew.details (7-day retention) ← Crew identity data │
│ • raw.schedules.details (7-day retention) ← Trip & roster data │
│ • raw.groundactivities.details (7-day retention) ← Ground duty data │
│ • dlq.crew-roster.msgs (31-day retention) ← Dead Letter Queue │
│ Schema Registry: gsr-platform-<env>-euwe1 (AWS Glue) │
└────────────────────────────┬─────────────────────────────────────────────┘
│
┌──────────────────────────────────────────────────────────────────────────┐
│ THREE Kinesis Data Firehose Streams (parallel, one per entity): │
│ • Crew Details Firehose → S3 (crew identity data) │
│ • Schedules Firehose → S3 (trip & roster data) │
│ • Ground Activity Firehose → S3 (ground duty data) │
└────────────────────────────┬─────────────────────────────────────────────┘
│
┌──────────────────────────────────────────────────────────────────────────┐
│ svc-crmpl-<env>-kinesis-transform │
│ • One Lambda handles ALL THREE Firehose streams │
│ • Transforms Firehose delivery records → S3 paths for Redshift Spectrum │
│ • Peak concurrency: 2–5 concurrent executions (MSK-like, well-bounded) │
└────────────────────────────┬─────────────────────────────────────────────┘
│ Data lands in S3 → Glue Catalog metadata
▼
══════════════════════════════════════════════════════════════════════════════
WAREHOUSE LAYER: Redshift Serverless (CDC Persistence)
══════════════════════════════════════════════════════════════════════════════
┌──────────────────────────────────────────────────────────────────────────┐
│ Redshift Serverless Warehouse │
│ │
│ STAGING TABLES (loaded via Spectrum external tables from S3): │
│ stg_crew | stg_trips | stg_roster | stg_ground_activities │
│ │
│ MAIN STORED PROCEDURE (EventBridge triggered): │
│ │
│ 1. Staging Load Procedure │
│ → Reads S3 via Redshift Spectrum external tables │
│ → Loads into staging tables │
│ │
│ 2. Schedules CDC Procedure │
│ → Reads staging tables │
│ → Compares vs final tables using composite key comparison │
│ → Loads into: crew_schedule_final (Schedules Data) │
│ │
│ 3. Ground Activities CDC Procedure │
│ → Calculates difference using master crew ID │
│ → Loads into: crew_ground_activities (Ground Activity Data) │
│ │
│ FINAL TABLES: │
│ crew_schedule_final ← Unified crew schedule view │
│ crew_ground_activities ← Unified ground duty assignments │
│ crew_roster_combined_sch ← Combined roster view for downstream │
│ │
│ CONSOLIDATED VIEW: merges schedule + ground activity tables, │
│ uses watermark columns for incremental reads by ECS service │
└────────────────────────────┬─────────────────────────────────────────────┘
│ ECS reads via watermark columns
▼
══════════════════════════════════════════════════════════════════════════════
OUTPUT LAYER: ECS → Curated Topic → SNS / API / Consumer Platform
══════════════════════════════════════════════════════════════════════════════
┌──────────────────────────────────────────────────────────────────────────┐
│ ECS Service (Curated Topic Writer) │
│ • Reads consolidated view from Redshift using watermark columns │
│ • Publishes incremental updates to curated Kafka topic │
└────────────────────────────┬─────────────────────────────────────────────┘
▼
┌──────────────────────────────────────────────────────────────────────────┐
│ MSK TOPIC: curated.crew-roster.consolidated (7-day retention) │
│ DLQ: dlq.curated.crew-roster.consolidated (7-day retention) │
│ Schema: Curated Schema Registry (AWS Glue) │
└────────────────────────────┬─────────────────────────────────────────────┘
│ MSK Event Source Mapping
▼
┌──────────────────────────────────────────────────────────────────────────┐
│ svc-crmpl-<env>-curated-to-sns │
│ • MSK-triggered (capped at 3 concurrent by partition count — safe) │
│ • Publishes to TWO SNS topics (PII / Non-PII separation) │
│ • Downstream consumers subscribe to appropriate SNS topic │
└────────────────────────────┬─────────────────────────────────────────────┘
│
┌────────────────┼─────────────────┐
▼ ▼ ▼
┌────────────────┐ ┌─────────────────┐ ┌───────────────────────────────┐
│ SNS PII Port │ │ SNS Non-PII Port│ │ Consumer Platform Integration │
│ (JSON) │ │ (JSON) │ │ │
│ → Consumers │ │ → Consumers │ │ SNS trigger (15-min refresh) │
└────────────────┘ └─────────────────┘ │ → svc-crmpl-<env>-consumer- │
│ export Lambda │
│ → Reads from Redshift tables │
│ → Writes to consumer S3 (in │
│ separate AWS account) │
└───────────────────────────────┘
══════════════════════════════════════════════════════════════════════════════
COMPLETE LAMBDA INVENTORY — CREW ROSTER MANAGEMENT PIPELINE
══════════════════════════════════════════════════════════════════════════════
┌─────────────────────────────────────────────────────────────────────────┐
│ FUNCTION │ TRIGGER │ CONCURRENCY PROFILE │
│ ────────────────────────────────────────────────────────────────────── │
│ svc-crmpl-<env>-batch-processor │ EventBridge │ Peak: 841 (!) │
│ svc-crmpl-<env>-api-to-raw │ EventBridge │ Peak: 2.6 │
│ svc-crmpl-<env>-kinesis-transform│ Kinesis FH │ Peak: 3.8 │
│ svc-crmpl-<env>-curated-to-sns │ MSK ESM │ Peak: 7 (MSK-capped) │
│ svc-crmpl-<env>-consumer-export │ SNS │ Peak: 1 │
│ ────────────────────────────────────────────────────────────────────── │
│ EventBridge-triggered (no partition ceiling — can scale freely): │
│ • batch-processor: peaked at 841 concurrent — the throttling cause │
│ • api-to-raw: peaked at 2.6 concurrent — well-bounded │
│ │
│ MSK-triggered (capped by partition count — self-limiting): │
│ • curated-to-sns: peaked at 7 concurrent — never caused starvation │
└─────────────────────────────────────────────────────────────────────────┘
══════════════════════════════════════════════════════════════════════════════
INCIDENT CORRELATION SUMMARY
══════════════════════════════════════════════════════════════════════════════
┌─────────────────────────────────────────────────────────────────────────┐
│ Aug 20-22 ── Pipeline bootstrapping in Dev │
│ Invocations: ~126/period │ Concurrency: 18-25 │
│ │
│ Aug 24 ───── ★ BULK HISTORICAL BACKFILL TEST IN DEV (INC-2026-001) │
│ Invocations: 197,427 │ Concurrency: 841 │
│ → All 8 UAT domains throttled (57,400 events) │
│ → Account pool: 841/1,000 consumed by this function alone │
│ │
│ Aug 25-30 ── Back to normal development │
│ Invocations: ~170/period │ Concurrency: 23-35 │
│ │
│ Aug 31 ───── Minor burst (INC-2026-002) │
│ 3 domains, minor throttling │
│ │
│ Sep 01-14 ── QA pipeline ramp-up │
│ CC Details Dev s3-to-raw scaling to 100-200 concurrent │
│ │
│ Sep 16-17 ── ★ ANOTHER TEST DATA LOAD (INC-2026-003) │
│ Batch processor: 102K invocations, 345 concurrent │
│ CC Details: 502 concurrent — combined: 847+ concurrent │
│ → 6 UAT domains throttled (~16,400 events) │
│ │
│ Sep 18-20 ── Testing paused — 0 throttles across all environments ✓ │
│ │
│ Sep 21+ ──── FIRST UAT DEPLOYMENT │
│ Normal concurrency levels — 0 throttles since ✓ │
└─────────────────────────────────────────────────────────────────────────┘
You've reached the end. Explore more engineering notes.
More Engineering Notes
ref›lambda-concurrency-crisis-shared-account-starvation